Portfolio
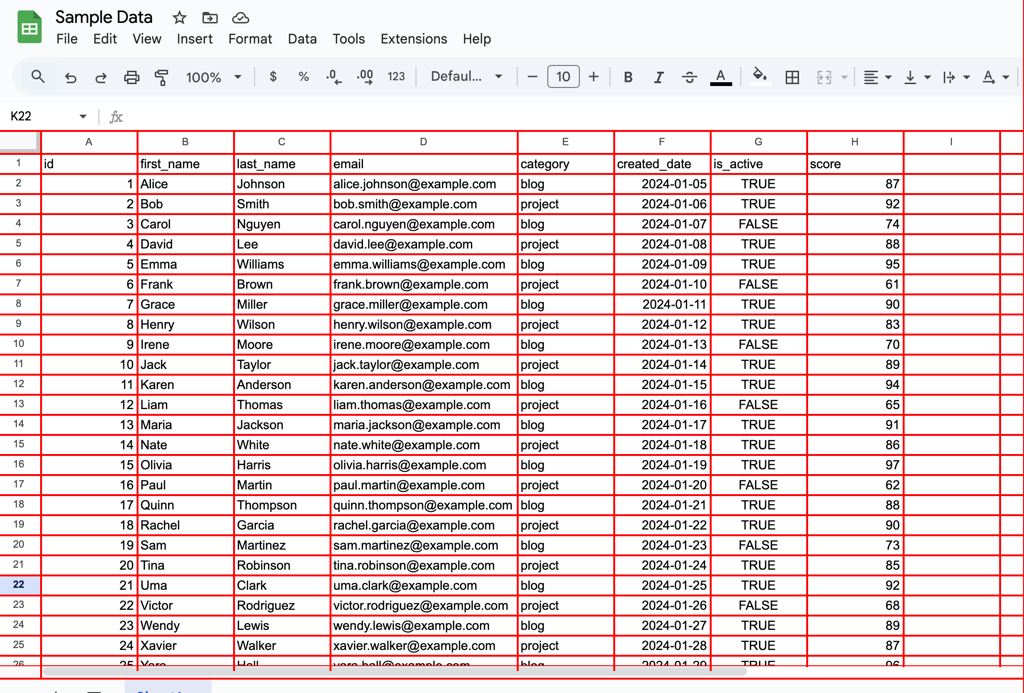
Spreadsheet Screenshots → Structured CSV
A computer-vision and OCR pipeline that converts unstructured image data into structured, machine readable tables. Define the problem I was presented with the task of taking screenshots of several spreadsheets and programmatically converting them into a csv file that could be imported into excel for the client to use. The screenshots were all very similar to one another but had their own idiosyncrasies. Manually translating from image to tabular data would have been time consuming and error prone. The challenge was to take image only inputs and reliably extract the information into tabular data while maintaining the original shape of the spreadsheets.ConstraintsThe input consisted only of screenshotsThe input data was similar but inconsistent layoutSome images introduced empty columnsOCR data is inherently noisy and misreads can occurThe final output needed to be tabular data, not just extracted textIn one case, I intentionally allowed merged columns to pass through the pipeline and corrected them in a downstream cleanup step, prioritizing overall system robustness over brittle edge handling.Solution ApproachMy first attempt at using the table recognition feature of paddle ocr failed to produce satisfactory output. I pivoted to a “grid-first” approach, using computer vision (cv2) in order to recognize the grid layout and locate “windows” where the cells were so the OCR could focus on small well-defined regions.I determined the locations of the average center points for column and row lines on the x and y axesDerived column and row bands which allowed me to identify cells in the imagesSliced the image base on the cell locations and ran the ocr on each cell one at a timeStored OCR results along with row position, column position, confidence score and bounding box metadataAssembled into pandas dataframe that was pivoted back into original table structureFlagged rows containing low-confidence scores to guide manual reviewTools and TechnologiesOpenCV (CV2)Paddle OCRPandasNumpyChat GPT (used as a development aid)ResultsThe pipeline successfully converted the screenshots into structured csv files, making the data searchable, analyzable, and reusable. For this project, the outputs were reviewed and combined manually since it was a small number of screenshots. The system is designed to support batch processing and could be fully automated with minimal additional work.OCR accuracy varies depending on image quality, and some manual review remains necessary for high confidence resultsConclusionThis project reflects how I approach messy, realworld problems with a client focused approach. Taking imperfect inputs, selecting and learning the appropriate tools, and designing future-proof systems without pretending that automation is always flawless. The goal throughout was to reduce manual effort while keeping end-user needs front and center.
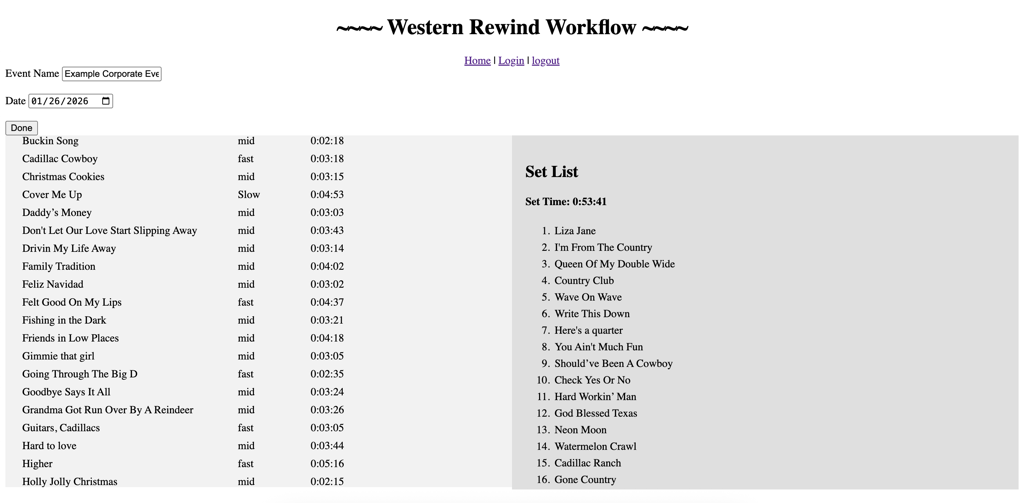
Band Director Workflow Automation Platform
A private web application that replaces a fragile, manual booking workflow with a structured, automated system for generating player-ready resources and correspondence. Define the Problem Booking musicians required assembling set lists, charts, audio references, and show notes from multiple locations. The process took up to two hours per gig, was highly error-prone, and frequently required follow-up emails due to missing or inconsistent information. All critical information needed to be centralized, reliable, and easy for players to access.ConstraintsHuman input is inconsistent and error-proneData lives across private Google services (Drive, Docs, Gmail)App must be usable by non-technical usersSecurity required (restricted OAuth access)Must be free to host and operateSolution ApproachI replaced free-form human input with a guided, structured interface that produces predictable, machine-readable output, which then drives a fully automated backend workflow.Set Building User InterfaceGoogle OAuth loginSong bank pulled dynamically from Google SheetsDual-list selection UI (available songs → selected set)Drag-and-drop reorderingLive set duration trackingBackend Automation PipelineRehydrates song objects by ID from submitted JSONCreates structured folders in Google DriveGenerates a formatted Google Doc setlistExports a PDF version automaticallyLinks charts and audio references via Drive shortcutsFlags missing charts for follow-upGenerates a Gmail draft with:Resource linksOutstanding action itemsSong-specific show notesTools and TechnologiesFlaskPythonGoogle APIs (Drive, Docs, Gmail, Sheets)Google OAuthResultsReduced prep time from ~2 hours to minutesEliminated missing information/files and follow-up emailsCreated a consistent, predictable format for recurring playersActively used in real booking workflowsConclusionThis was my first live web application. The frontend was built with minimal JavaScript and CSS knowledge, prioritizing functionality over polish. Later frontend learning informed how I would approach this differently today, but the system architecture and automation decisions remain sound.
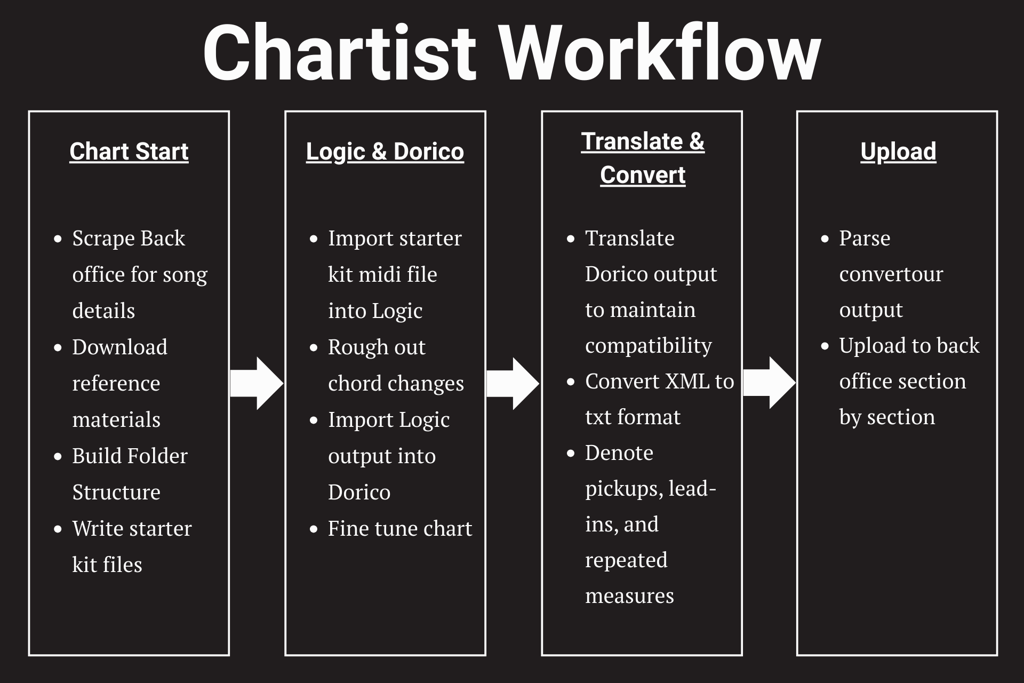
End-to-End Automation for a Professional Music Charting Pipeline
A continuously active workflow companion that automates and coordinates the full professional music charting pipeline. The system evolved into a persistent tool that the client keeps open while working, coordinating setup, transformation, and delivery tasks as part of the creative process.Define the problem A professional music chartist workflow relied on a series of repetitive, tightly coupled manual steps spread across multiple tools and platforms. The process depended on strict conventions, manual data transfer, and deep domain knowledge, making it fragile and time-consuming.While the initial need was narrowly scoped—adapting XML output to be compatible with an existing script—this quickly exposed broader inefficiencies across the entire charting lifecycle, from project setup and resource gathering to production and delivery.ConstraintsMultiple tools with incompatible formatsPrivate portalsDomain-specific rulesExisting legacy scriptSolution ApproachThe solution evolved into a companion workflow system for multi-tool music charting, spanning Logic Pro, Dorico, and a legacy publishing pipeline. Rather than replacing existing tools, the system orchestrates data flow between them while preserving strict output compatibility. Modular utilities handle tasks such as project setup, XML interpretation, metadata synchronization, and final format translation. A GUI provides visibility into each step, allowing multiple charting projects to be managed concurrently. Domain-specific musical edge cases—such as time signatures, pickups, and repeating measures—required adaptive parsing strategies to ensure accurate translation from notation software to the company’s required publishing format.The system was designed to work alongside the chartist rather than replace their tools, automating transitions between steps that were previously manual and error-prone.Tools & TechnologiesPythonSeleniumTkinterMIDIUtilResultsThe result is an end-to-end charting companion that stays open throughout the entire charting process, automates setup tasks between steps, and ensures outputs from one tool consistently match the inputs required by the next. By removing repetitive, error-prone work and reducing context switching between external tools, overall productivity increased from 3–4 charts per week to approximately 3 charts per day.